Genesis
Around the same time as the Watch and Pulse programs went live, the health system was also ramping up COVID testing efforts. Communicating these results quickly required personnel to make the phone calls. There was no centralized team that could take on this work especially given the large volume of tests being performed. At this early stage, outpatient and elective procedures were shut down. These clinicians were re-deployed to help with results communication. This effort ensured both real-time result delivery, symptom triage, education, and care coordination. These clinicians were also responsible for the rapid uptake of COVID Watch. However, as the system began to re-open in the summer and the clinicians were being called back into their usual practice, this manual approach quickly became unsustainable. The initial thought was to leverage the patient portal, however, given it’s disproportionate use in various populations, an alternate strategy was needed. This is where Way to Health came in.
Operational implications
While the manual approach of outreach was possible, it just could not be sustained. As testing became more readily available, the thought was to focus on the communication of negative results. This was further confirmed as the positivity rate dropped dramatically from 33% in the initial phase to 2.9% over the subsequent months as testing became more broadly available.
As an aside, while this drop seems “dramatic”, it is easily explainable. If you had a limited supply of tests, who would have tested? Those that in your clinical opinion (remember these are MDs ultimately ordering the tests) are at a higher risk, right? And once testing was broadly available, well, let’s get everyone tested.
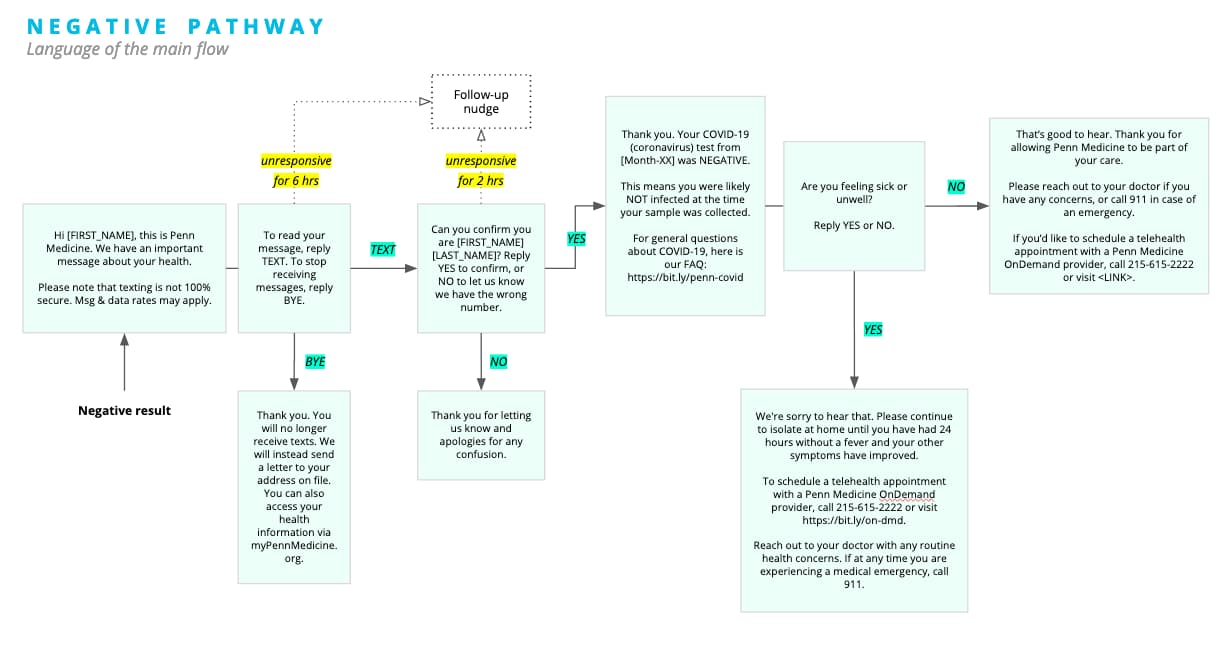
In any case, these negative result conversations tended to be quick and all the patient needed was the result notification and not much more than that. So we started there. We followed the workflow outlined below.

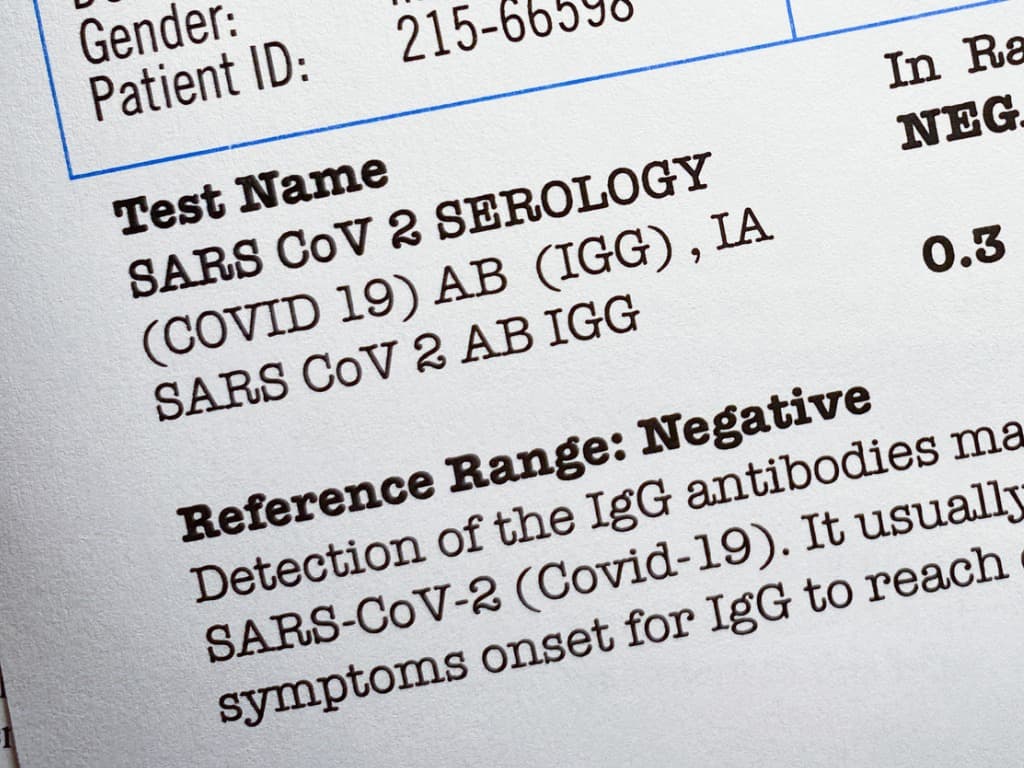
Next we developed similar pathways for indeterminates i.e. folks for whom the test results were inconclusive and needed to be brought back for a re-test. And ultimately for positives. The last one took a lot of back and forth. We finally went with an approach wherein the RNs would try calling the patient at least twice. If they were unable to reach the patient after two attempts, they would be put on a list and W2H would attempt to reach out to them via text. During this period, other patient populations were also addressed such as employees and more.
All of this required integration with:
- EPIC / PennChart: Reporting Workbench outputs and associated data transfers
- Occupational Medicine: This turned out to be more complicated than anticipated but we were able to make this work as well. A parallel program called PennOpen Pass was set up to give employees red or green passes depending on a self-reported symptom questionnaire.
Variants
Penn Medicine is part of the University of Pennsylvania. As re-opening of the University was being planned, there was interest in leveraging the experience gained from Watch and this results reporting project. The scale of that was larger than we’d anticipated. The goal was to be able to communicate over 10,000 tests per day. We’ll discuss this in a subsequent blog post.
At the same time, we had a program using saliva based testing (COVID SAFE which we will discuss in, yep, you guessed it, a subsequent blog post) targeted at employees as the health system and University tried to bring operations back to “normal”.
Other variants which we won’t go into details about but please be assured these were needed:
Occupational Medicine: Because OSHA and other regulations not to mention that we care about our employees a lot.
Emergency departments: Patients showing up the ED often don’t have a primary care physician (PCP) so if an test order is placed, who should follow-up? Well, the ED right? But how do we route these appropriately? If positive, what needs to be done? A combination of technology and training addressed these issues. We will delve into this in more detail when possible.
Ramping up and numbers
25,000 results managed: In the initial phase, 80 dermatologists manned the results reporting lines since their procedures had been temporarily halted. The positivity rate was about 33% in this initial surge period.
3-15 mins per call, 1-3 attempts per call: These are rough estimates. As you can imagine, tracking use wasn’t a high priority at the time. These numbers are borne out by the experience of the call center and RNs from the PMOD (Penn Medicine on Demand) teams.
21,194 of 48,000+: Penn went with a de-centralized approach to allow primary care physicians and others to begin to own the communication of the test results. The positivity rate during this period was 2.9% given the broader availability of testing. Given this, we set up the automated SMS based approach to communicate negative results to begin with. The thought here was to eliminate the need to call and communicate negative results and focus the qualified team on just positives since that would be where questions and concerns would surface and when patients would need the most amount of support. Over time, we began to address indeterminates and positives as well. To be clear, we only addressed the subset of positive resulted patients after two attempts of manual outreach.
More to come
This is being written up as a paper / presentation. What I really want to highlight here is that because of the automation we could put into place quickly, Penn did not have to spend a significant amount of resources to make 21,194 calls (at least). If the number of attempts and the amount of time spent per call are any indication, this automation has saved us at least 21,194 x 5 min x 1.5 calls (on average) = 2650 FTE hours. Additionally, I would urge you to consider that this is a conservative estimate and that the actual investment needed to hire the individuals required to manage that would be much higher. Secondly, this number also does not consider the investment needed to scale out to support the anticipated 10,000 tests per day.
People
I haven’t done this in prior posts but I wanted to call out some of the key people (in alpha order by last name) who played a significant role in the success of this program.
- Nancy Bonalumi
- 80 Dermatologists
- Lauren Hahn
- Ann Huffenberger
- Neda Khan
- Michael Kopinsky
- Kathleen Lee
- Adam Leko
- Colleen Mallozzi
I’m sorry if I missed some people. I’ll attribute that to the fact that some of the individuals listed above acted as liaisons with other teams. These are basically the people that the W2H team worked with closely.
Hope you found this post useful. Please feel free to drop us a line via the Contact link below and we’ll be happy to discuss this more with you. Look for part 4 of this series next week.


